
Automatic field delineation
AI traces the edge of each field from satellite imagery. No surveyor and no hand-drawn polygon. The output is a set of field polygons.
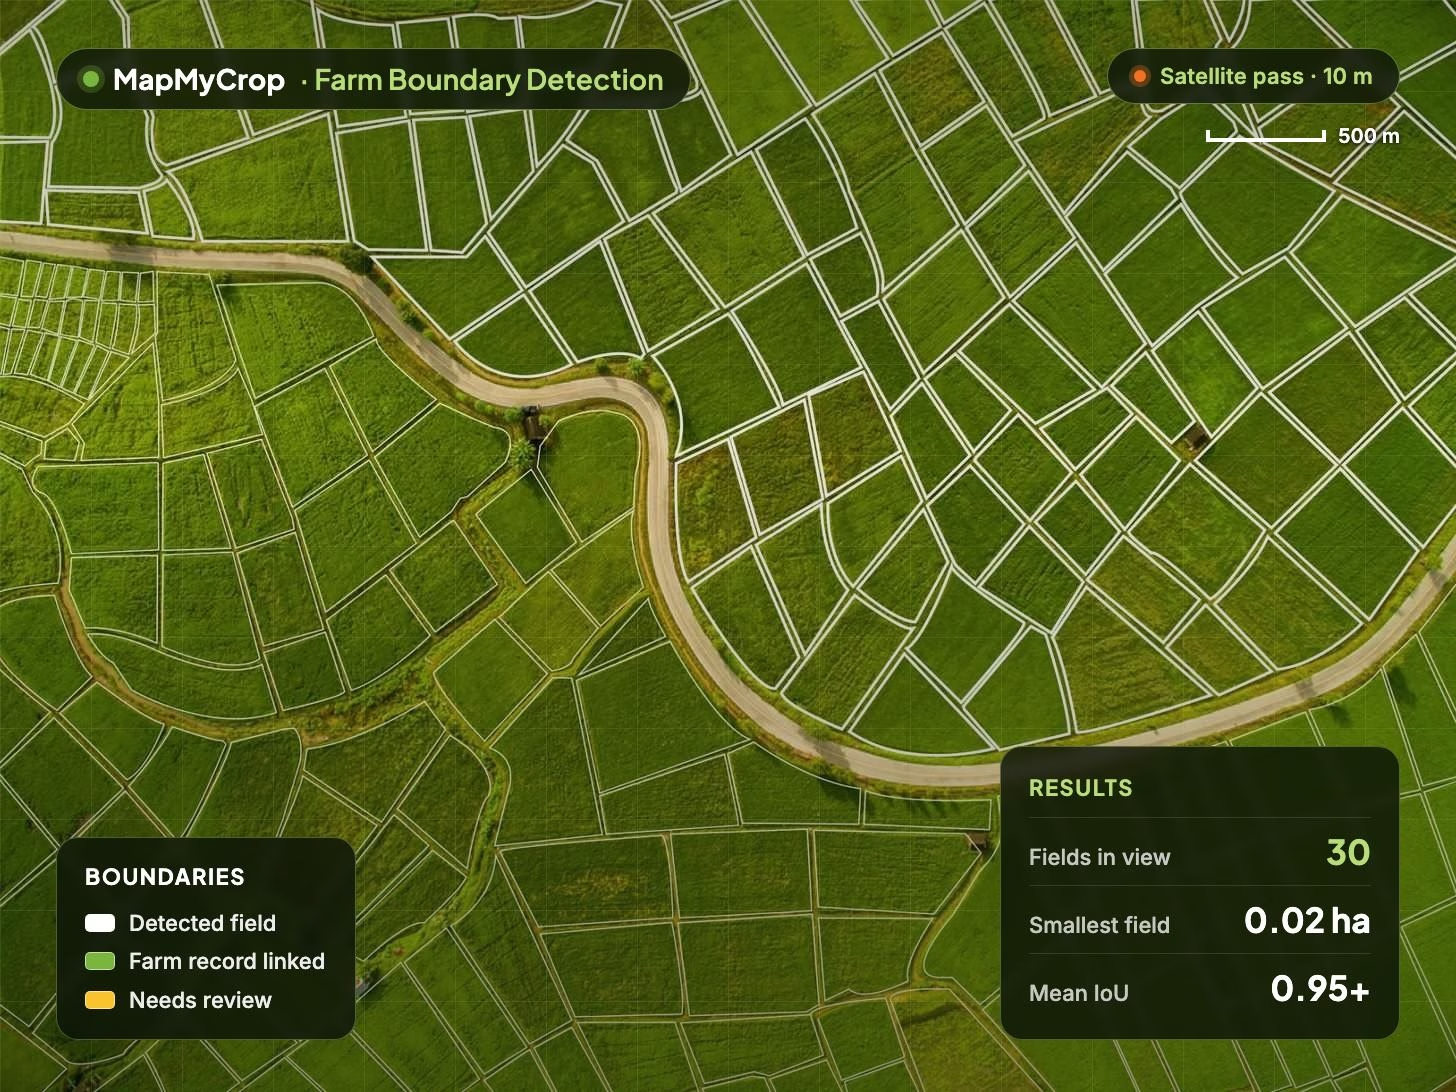
Map, legend and results in one view.

Farm Boundary Detection
Maps farm and field boundaries automatically from satellite imagery. Give us a location or region and get dated field polygons with area back, ready for lending, insurance and farm management systems.
Farm Boundary Detection uses AI on satellite imagery to trace the edge of each field, from fragmented smallholder plots down to 0.02 ha to large regular parcels. Each polygon carries its area, a confidence score and the imagery date.
AI traces the edge of each field from satellite imagery. No surveyor and no hand-drawn polygon. The output is a set of field polygons.
Built for fragmented smallholder plots as well as large regular parcels, with a minimum field size of 0.02 ha.
Re-runs on fresh imagery when fields are split, merged or newly cultivated, with dated boundary versions for up to the last 10 years.
Each polygon carries a field ID, area in hectares or acres, seeded and non-seeded area, a confidence score and the imagery date.
Links a detected field to its cadastral or ownership record and reports the overlap. Available in 40+ countries, including India.
Files in CSV, GeoJSON, KML and shapefile, API delivery into your own systems, or a partner-branded web or mobile app with offline mode.
What is planted, field by field
Field-level crop health
Detail where satellites stop
Boundaries in your systems
A mapped record from a location instead of a site visit, so survey crews and specialist equipment are not booked for every farm.
Each farmer gets a verified field record at onboarding, which shortens the time to issue a loan or a policy.
Compare self-reported area with mapped area to catch over-declaration in subsidy, credit and insurance portfolios.
Track the share of farms in the book that have a satellite-derived polygon, for audit and compliance reporting.
Re-map on demand and compare boundary versions to see fields split, merged or newly cultivated between seasons.
A verified boundary is the starting point for crop type, monitoring, prediction, risk and reporting across MapMyCrop.
It maps farm and field boundaries automatically from satellite imagery using AI. You supply a location, a bounding box or a custom area and receive field polygons with area, a confidence score and the date of the imagery used.
Banks, insurers and lenders onboarding farmers at scale, cooperatives and agribusinesses that need a digital farm record, governments and NGOs running land or subsidy programmes, and agritech companies that need boundaries in their own apps through the MapMyCrop API or a white-label app.
Boundary accuracy is measured as intersection over union (IoU) and is above 0.95. The minimum field size is 0.02 ha, so fragmented smallholder plots are mapped as well as large commercial parcels. Each polygon also carries its own confidence score.
Yes. Boundaries are available for up to the last 10 years, versioned by year, and can be re-mapped on fresh imagery when fields are split, merged or newly cultivated. Each version is dated to the imagery used.
In 40+ countries, including India, a detected field can be linked to its cadastral or ownership record, such as a parcel register, and the overlap reported. This supports subsidy, credit and insurance checks.
Boundaries are delivered through the platform, the API, a white-label app or as CSV, GeoJSON, KML and shapefile exports. Most teams pair it with Crop Type Detection to label each polygon and Crop Monitoring to follow health through the season.
Tell us your region, crops and use case and we will show you boundaries for an area you choose.
MapMyCrop is used by 7M+ farmers across 80+ countries. Talk to our team about mapping field boundaries for your portfolio, programme or app.


