We help farmers to get reliably better yields and to save up to 30% costs on fertilizer usage.
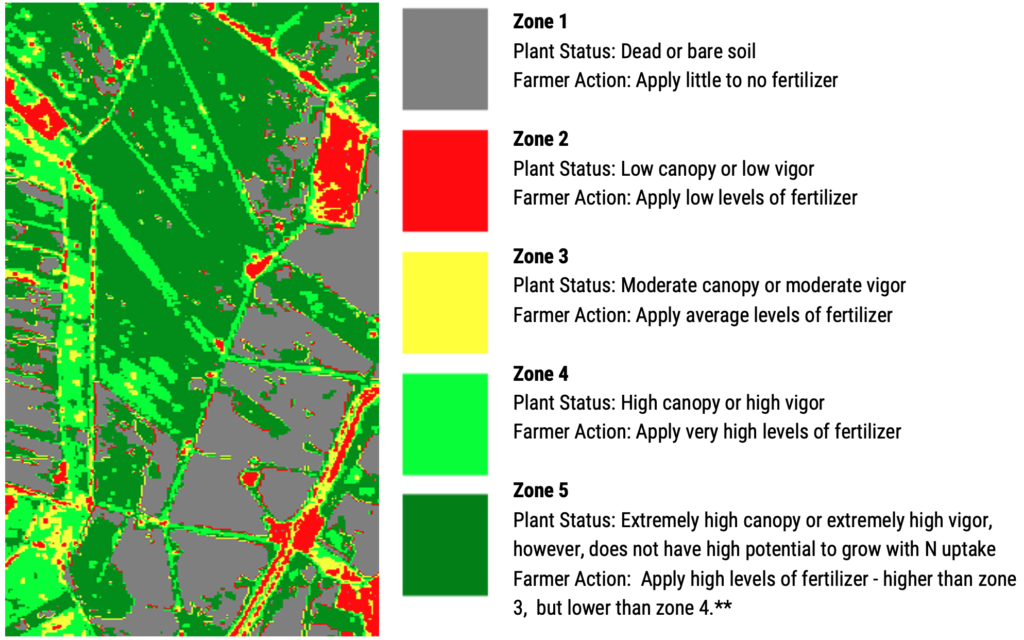
Create zones and prescription maps to identify and manage problem areas in your field.
Zone Creation
Automatically and manually created zones based on 30-year history imagery, soil (agrochemical analysis, scanners data, EC, moisture), and topography data.
Set Rates
Set rate for ag-input product, calculate product cost, use industry-standard equations, or create your own. Calculate your Investment and Savings in one click.
Customize
Create, Draw, and Spilt the Draw in multiple zones or create it automatically, which can be divided based on fertilizers zones.
Export
Creation of VRA maps that are compatible with most ag machinery. Use the simple export tool and import your Machines.
Our nitrogen prescription files work for all the modern machinery and technology supporting ISOBUS
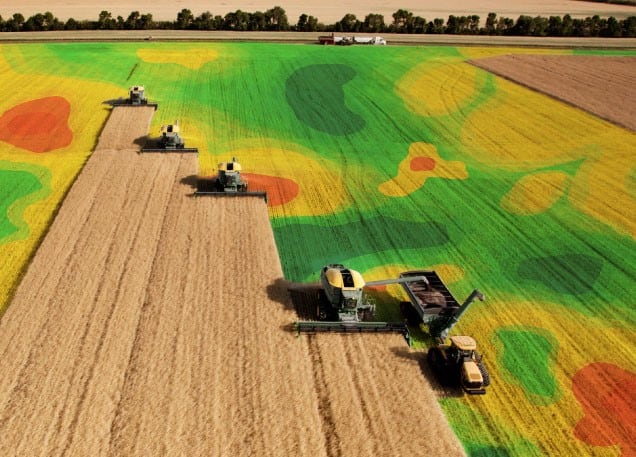
Our Productivity Maps is the only service collecting seven years of historical yield variability data. Used as a benchmark, farmers can understand better varying the productivity within a field and optimize resource allocation thereafter. We enable precision agriculture through the use of satellite imagery and cutting-edge algorithms. Our algorithms show there is significant variability in the fertilizer requirements from some areas of farmland to others, even when the crop type is constant.
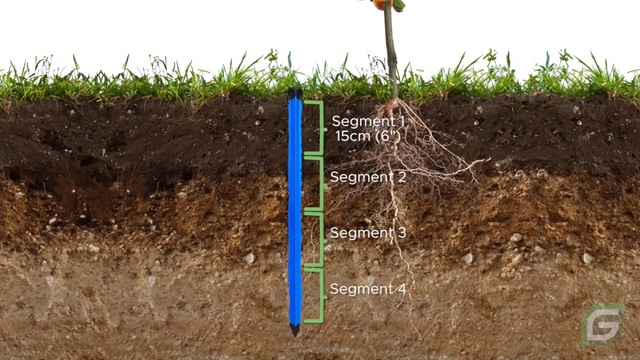
Sufficient levels of soil moisture are an important condition for proper plant formation and high crop yields. Monitor soil moisture for every field, to keep your crops from waterlogging and droughts and improve yields. Remote soil moisture measurements are based on satellite data that use the reflection of electromagnetic radiation of a specific spectrum from the soil surface.
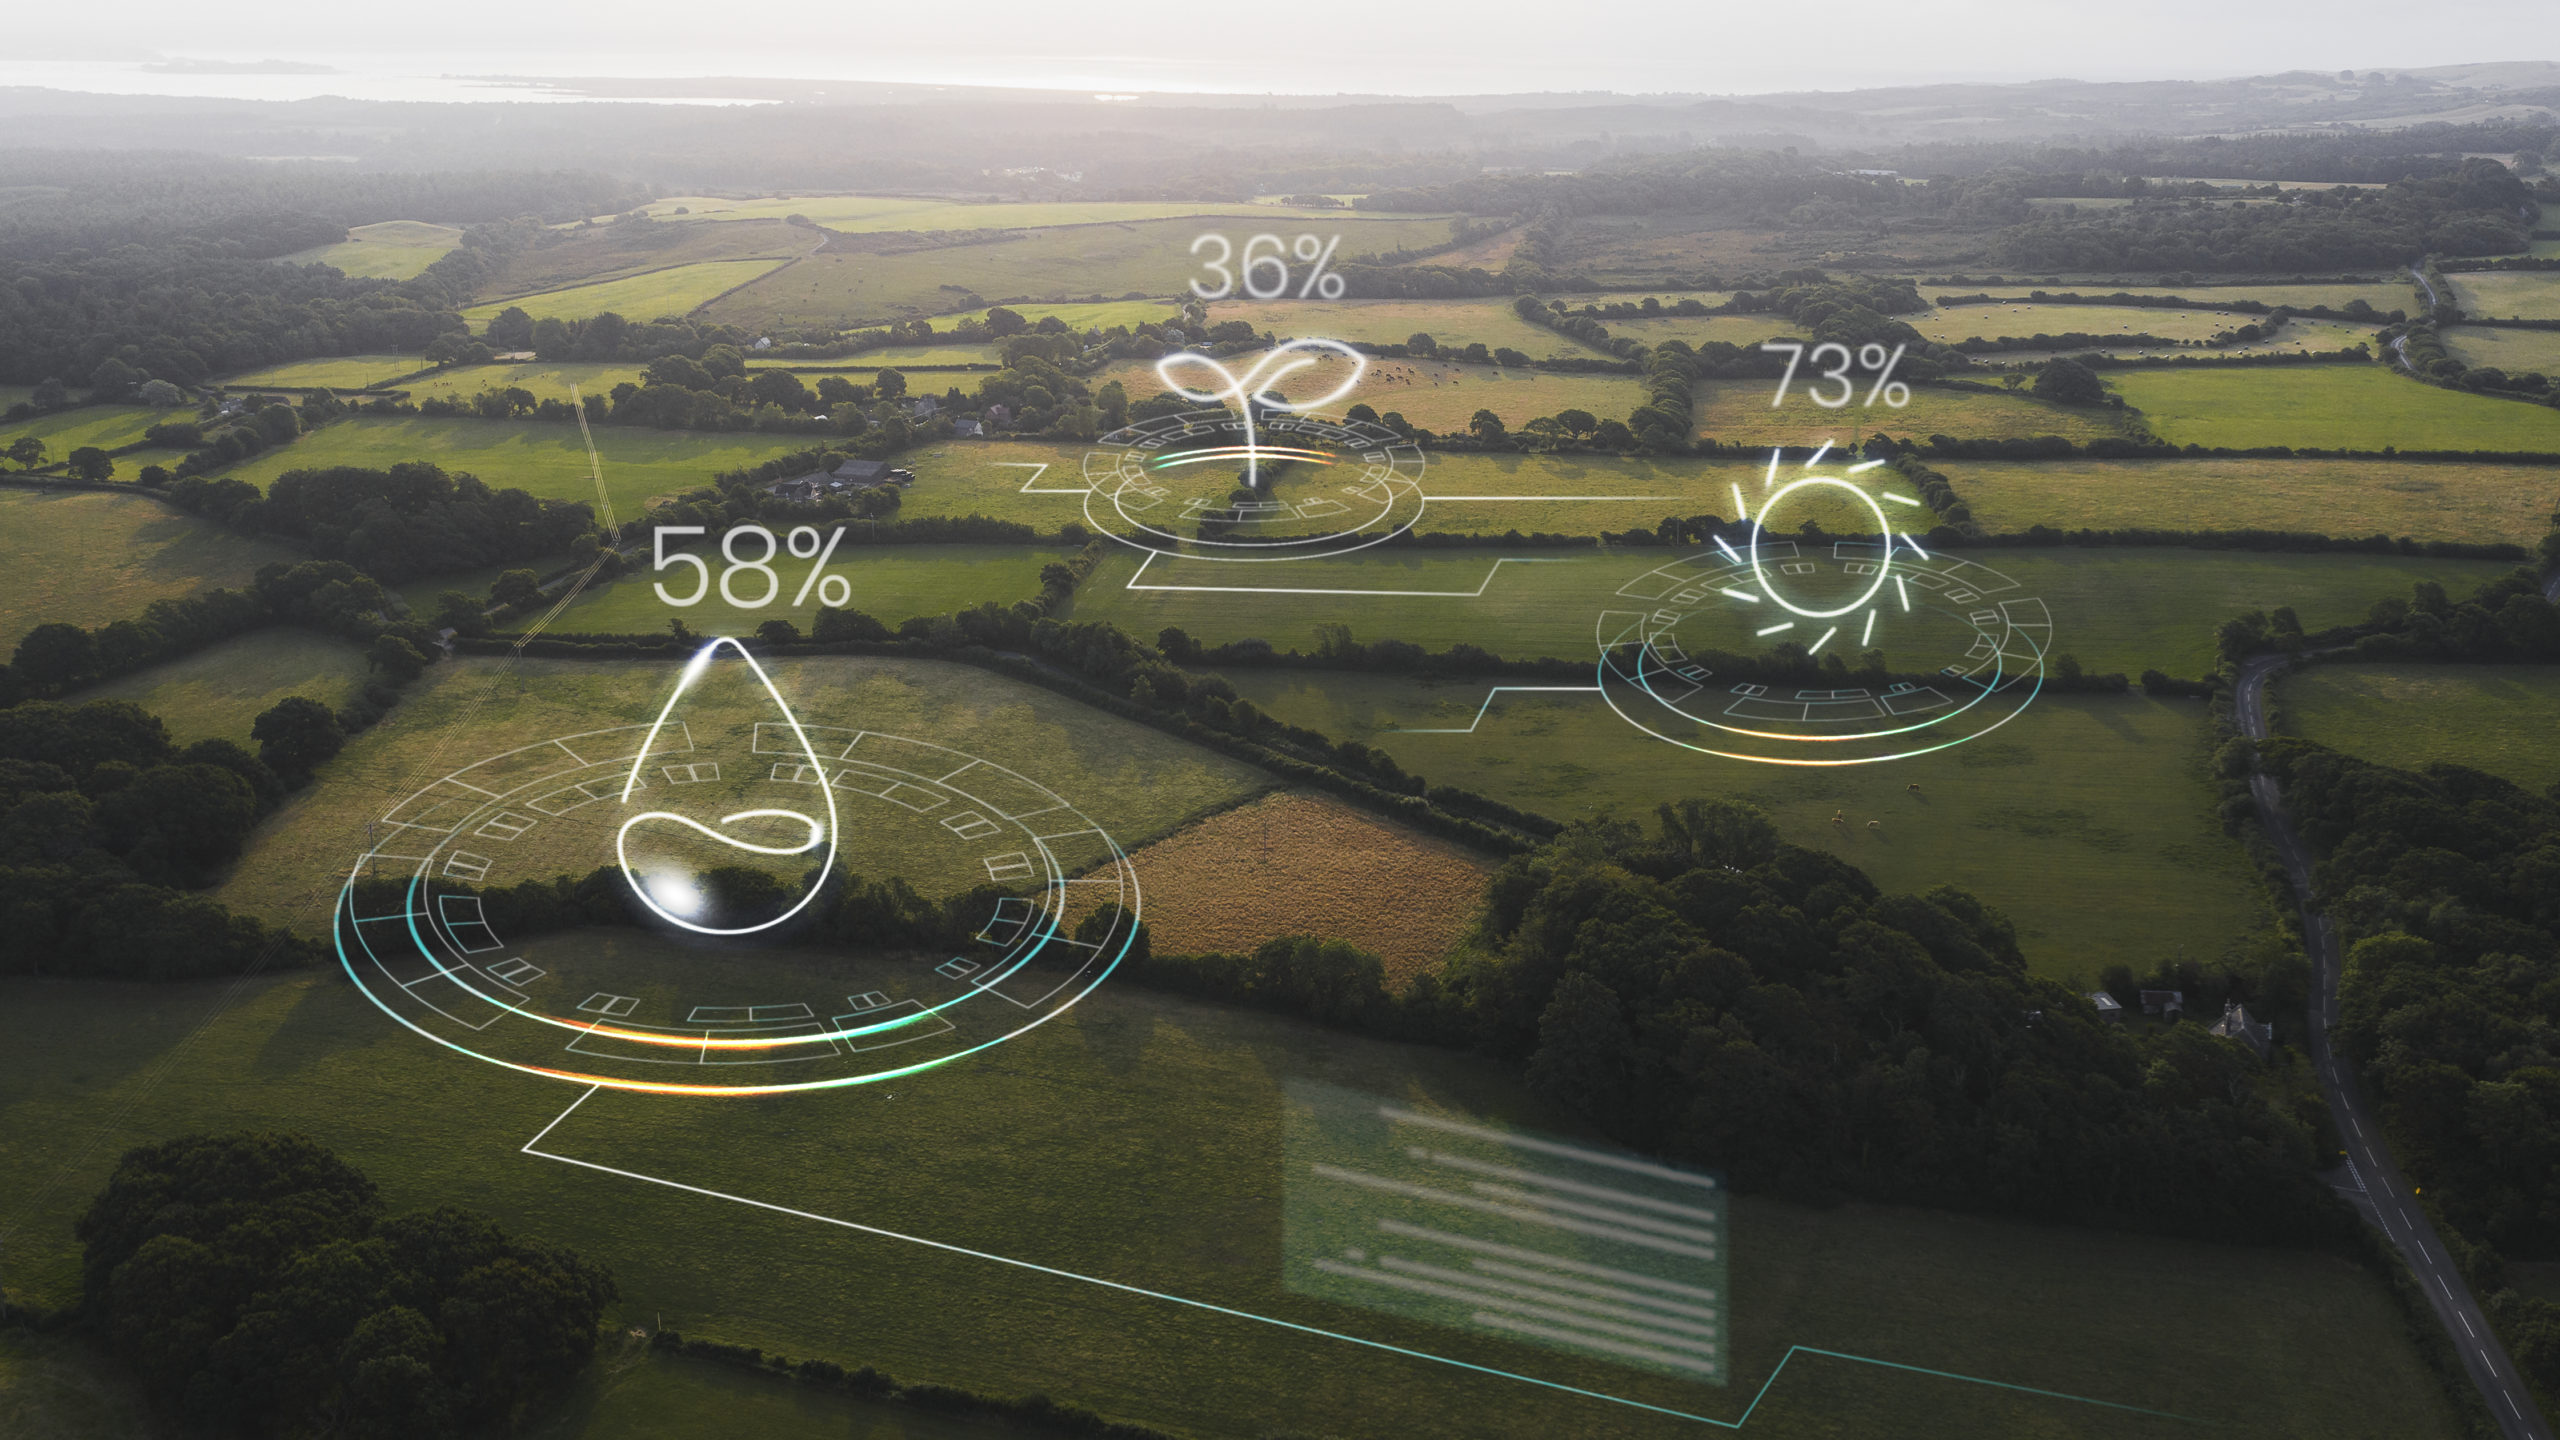
We collect more than 40+ Weather Daily Points. Data sets include air temperature, humidity, wind speed, and other significant weather parameters. The data is frequently updated based on global models and data from more than 40,000 weather stations.
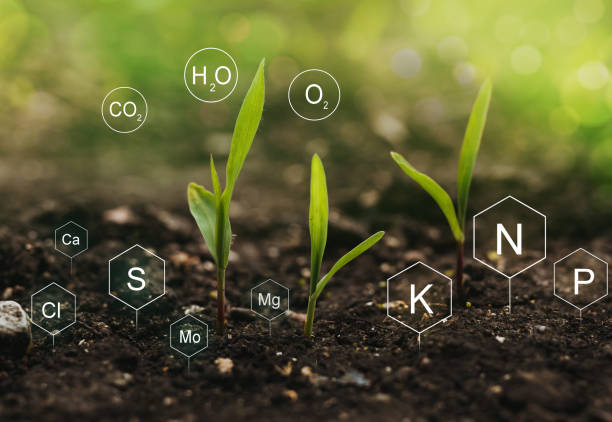
Complete nitrogen fertilizer application guide based on satellite and weather data, specially developed for cereal and canola crops
The crop’s demand for nitrogen is determined by measuring the soil supply of nitrogen and the total crop nitrogen needs to be based on historical data, and the status of the crop
Using the right amount of nitrogen at the right place and time means you can achieve good quality and yield with minimal fertilizer use as well as environmental impact
Satellite-based monitoring of present nitrogen levels in the soil provides more accurate, rapid, cheaper, and detailed maps of variations in the field, replacing traditional soil sampling
Nitrogen supply measurements are taken via remote sensing and its properties are compared to a catalog of 20 000+ soil sample tests
The levels of nitrogen vary greatly within a field and at the start of the growing season impacts the crop’s nitrogen fertilization demands throughout the season
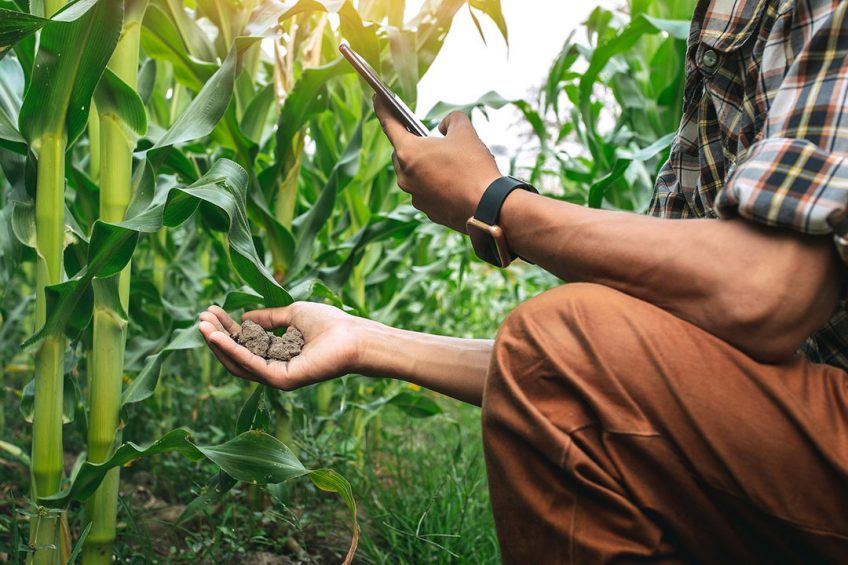
Maps that allow farmers to monitor crop-specific health indicators
Our measurements are crop-specific and combine both multispectral and microwave remote sensing, which means we can get data even in cloudy conditions
Monitoring plant health can help growers detect issues in their fields and understand their variability
Maps showing the historical performance of different parts of the field
Our algorithm collects satellite measurements over the last 7 years to benchmark historical yield variability
With the maps, farmers can better understand what parts of the field are over and underperforming, to optimize resource allocation and profitability
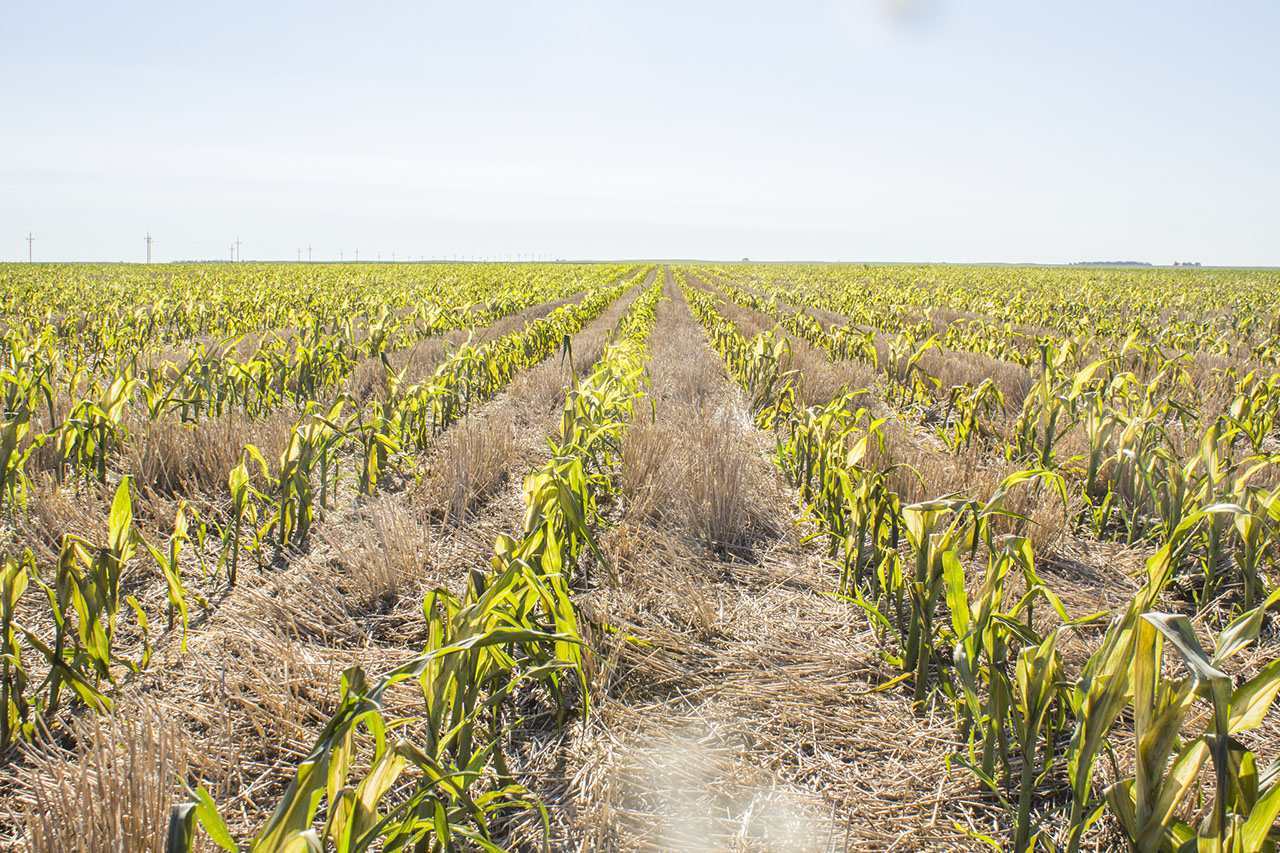
Maps showing the level of water stress in the field
Using multispectral data including infrared light, we can measure the plant moisture and heat to determine the water status and stress levels
With better information about water needs, growers can direct their irrigation equipment and understand a key crop stressor that impacts yields
And More
Weather Alerts
Get notified about upcoming critical weather conditions
Location Specific
Get weather alerts for your Location and not your area.
Soil Data points
Adjust irrigation work and prevent crop roots damage.