One view across every farm, estate and supplier
Monitor many farms and estates in one dashboard, compare their condition on the same measures, and report on risk and sustainability from one satellite record.
What gets in the way

Every farm is tracked separately
Crops, trees and estates are tracked in separate tools, often on paper. Leaders see condition late and cannot compare farms on one measure.

Portfolio exposure is hard to see
When each farm reports on its own, concentration by crop and region stays hidden until weather or disease affects several sites.

Sustainability data is chased
Teams collect supplier surveys to report on sustainability. The data is inconsistent and hard to defend to auditors.
Where to start
Begin with one view of every farm and estate, then add risk, forecast and sustainability layers on top of the same records.

Farm Monitoring
Tracks crops and trees on the same holding in one view and keeps each field and block as its own reporting unit. Every monitoring product includes the enterprise dashboard.

Crop Monitoring
Watches crop health field by field, with field-level weather, alerts and advisories, so farm teams act while there is still time.

Risk Intelligence Suite
Shows concentration and exposure by crop and region, ranks risk, and flags drought, flood, frost, heat and disease ahead of loss.

Sustainable Agriculture Suite
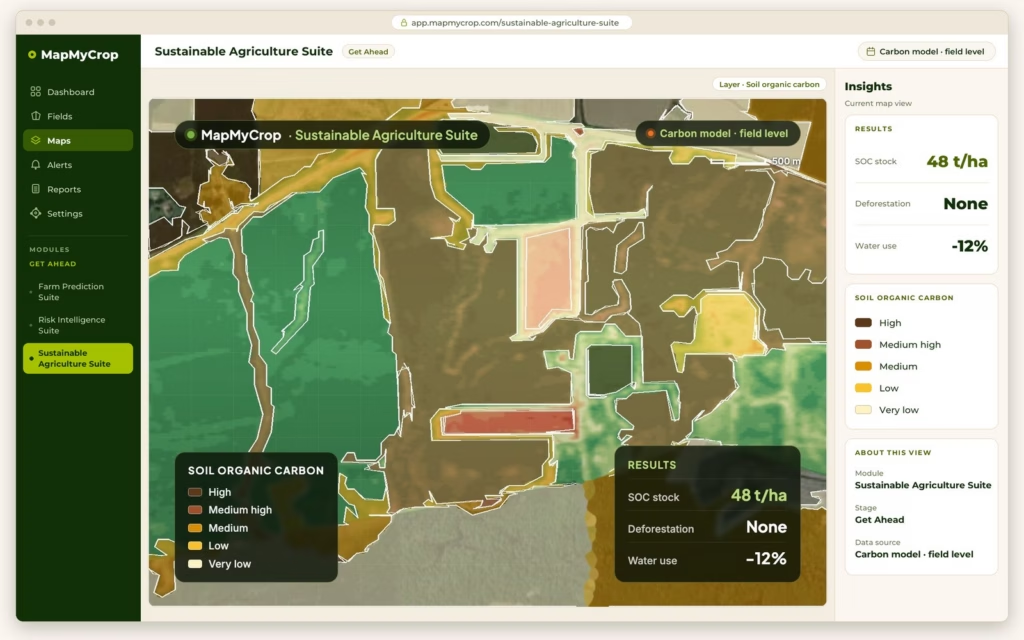
Verifies practices from satellite, tracks water use and deforestation, monitors farm methane emissions and gas concentrations, and packages evidence for sustainability and Scope 3 reporting.

Farm Prediction Suite
Estimates yield and harvest timing across farms, regions and crops, so procurement, logistics and labour plans follow one forecast.
What the enterprise dashboard shows
A regional to global view across every farm, estate or stand.
Rankings
Top and bottom performing farms by vegetation status.
Expected yield and acreage
Totals by region, with a crop or block breakdown.
Alerts
Units whose condition departs from their usual pattern.
Weekly reports
Scheduled summaries for managers and head office.
Filters
Narrow the view by country, state, district and sub-district.
Your own estates and the farms you source from
Estates you operate
- Crop and tree health by field and block
- Farm diary for activities, equipment and cost per activity
- Scouting tasks assigned and recorded
- Dated imagery kept with each unit
Suppliers and outgrowers
- Polygon-level sourcing maps linking plots to shipments
- Crop labels and acreage per supplier field
- Practices verified from satellite, not surveys
- Supplier scores that show where to invest
A sustainability score for every field
Practice maps for crop rotation, cover crop and reduced tillage feed one score map. Rate farms on the practices they have adopted, see the current score or the change over time, list the top sustainable farms, and set your own weighting for each practice.
Emissions monitoring across your farms
Monitor farm methane emissions from satellite, and the concentrations of six gases over the areas you farm, next to the practice and sustainability maps. Map My Crop supports verification and reporting for carbon programmes. Farm methane estimates draw on crop type, growth stage, soil moisture, temperature, precipitation and remote sensing. This is monitoring of emissions and concentrations. It is not a certified carbon claim or a carbon credit.
Reports at three levels
Weekly
Dashboard summaries and alerts for operations teams.
On demand
Reports for a farm, a region or a crop, scheduled or run when needed.
Evidence packs
Metrics, methodology and dated imagery packaged for sustainability reporting and audit.
Project-reported results: input cost and farm visits at Baramati
Baramati, India: satellite crop monitoring, AI-based agronomist advisory and variable-rate (VRA) fertiliser maps for sugarcane and other crop growers, with a ground team acting on the platform’s insights. Lead partner: Agricultural Development Trust, Baramati (ADT). Other parties: Map My Crop, the University of Oxford and Microsoft. Reported by Map My Crop for the Baramati project. These are results for that project, not a promise for other farms.
41%
Average input cost reduction
75%
Reduction in farm visits
How it starts
Book a demo
Tell us how many farms and estates you run, the crops and trees on them, and the reports your head office needs. We reply within one business day.
See it on your portfolio
We walk through the platform with your own location or portfolio and agree the products that fit.
Review the portfolio view with our team
Open the enterprise dashboard together, then add risk, forecast or sustainability layers where you need them.

Bring every farm and estate into one view.
Book a demo and tell us about your portfolio. We reply within one business day.