
Land, crop and forest evidence for programmes and policy
Measure farm boundaries, crop area and forest change from satellite data, and keep dated records for programme monitoring, audit and reporting.
What gets in the way

Statistics arrive after the season
Crop and production figures come from surveys and farmer reports. They arrive late and vary by source, so decisions wait for the data.

Programmes rest on self-declaration
Subsidies and schemes depend on declared area and declared crop. Checking them on the ground is slow and expensive at scale.

Compliance needs dated evidence
Forest change is often seen through periodic surveys or third-party alerts with no local context. Reports to regulators and buyers need dated proof.
Where to start
Start with a digital record of land, then add crop, forest and forecast layers as your programme needs them.

Farm Boundary Detection
A mapped field record is the base layer. Every area, crop and forest figure that follows is counted against it.

Crop Type Detection
Labels the crop in each field, with support for 200+ crops, and totals acreage by crop for a region. Compares the declared crop with the detected crop, without waiting for enumeration surveys.

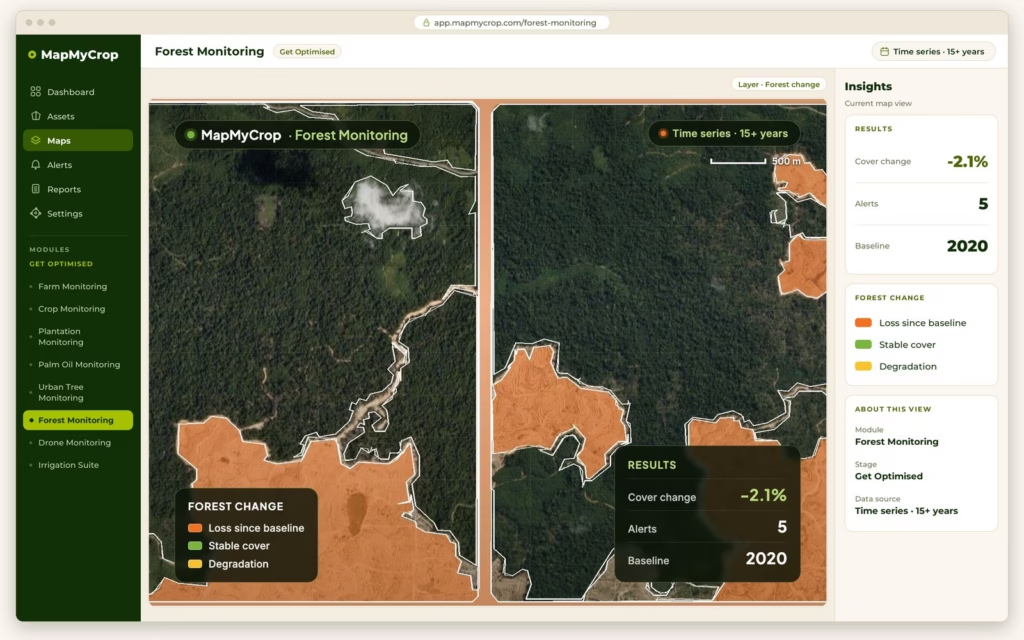
Forest Monitoring
Detects clearing and tracks forest loss over time, with dated imagery and reports that can support verification and audit, for example under EUDR or RSPO.
Farm Prediction Suite
Estimates yield, crop area and harvest timing per region from satellite data and weather forecasts, and revises them as the season unfolds.

Sustainable Agriculture Suite
Tracks practices, water use, deforestation and land-use change, monitors farm methane emissions and gas concentrations, and packages metrics with methodology and dated imagery for climate-smart programme reporting.
Questions a programme team can answer
Three checks a programme team can run
Emissions and air-quality monitoring for climate programmes
See where gas concentrations and farm methane emissions are building across a region, to support climate programme reporting. Map My Crop supports verification and reporting for carbon programmes. This is monitoring of emissions and concentrations. It is not a certified carbon claim or a carbon credit.
What an evidence pack carries
Each report keeps its own proof, so a reviewer can trace a figure back to the imagery.
Records that reach back in time
Up to the last 10 years
Field boundaries, versioned by year, so land-use change can be tracked.
15+ years
Of satellite data behind the time series.
40+ countries
Where a detected field can be linked to its cadastral or ownership record, including India.
How it starts
Tell us your region or programme
Book a demo and describe the area, the crops and the questions your team must answer. We reply within one business day.
See it on your area
We walk through the platform with your own location or portfolio and agree the products that fit.
Review the first maps with our team
Check boundaries, crop labels or forest change together, then choose which layers and reports to add.

Measure land, crops and forest with dated evidence.
Book a demo and tell us the programme you run. We reply within one business day.